今回は,scikit-learnなどの既成ライブラリにできるだけ頼らずに,画像に主成分分析を施していこうと思います。また,本記事はpython実践講座シリーズの内容になります。その他の記事は,こちらの「Python入門講座/実践講座まとめ」をご覧ください。
読みたい場所へジャンプ!
- 主成分分析
- 「画像に主成分分析を行う」とは?
- 必要なライブラリのインポート
- Googleドライブをマウントして画像を取り込めるようにする
- データを配列化する
- オリジナル画像の可視化
- 固有値・固有ベクトルを求めて大きい順にソートする関数
- データの統計量を求める
- 上の式に従い共分散行列の固有値・固有ベクトルを求める
- CCR(累積寄与率)を求める
- CCR(累積寄与率)を4本目まで表示
- 基底の本数を選ぶ
- 基底を可視化
- 3本の基底でデータ再構築
- チョキの画像を適当に表示
- グーの画像を適当に表示
- パーの画像を適当に表示
- 基底を1本だけにした場合の再構成
- 基底を42本全て選んだときの再構成
- 基底を2つでクラスタリング
- 基底を1つでクラスタリング
- 考察
- もし理論にモヤモヤがあれば
- 全コード
主成分分析
こちらの記事で詳しく説明しています。

「画像に主成分分析を行う」とは?
個人的に一番ハマってしまったところです。PCAの話題でよく挙げられる,二次元プロットされたデータ集合に主成分分析を行うの例はよく分かります。要するに,二次元データを一次元に落とすというモチベーションだからです。
それでは,上の考え方を画像に適用するというのはどのような流れで行うのでしょうか。まず,画像における次元というのは画像のピクセル数そのものです。たとえば,画像をデータ化したときに「64×64」サイズの行列であった場合,その画像の次元は「64×64」次元になります。そして,1枚の画像データは「64×64次元空間に存在する1つの点」を意味しています。
私が誤解していたのは,1枚の写真に対して主成分分析を行うものだと思っていた点です。1枚の写真は超次元空間の1つの点でしかないので,次元を落とすとシンプルに情報が欠落していきます。つまり,「64×64」ピクセルで表されていた元画像を,例えば4つのピクセルをひとまとめにして「16×16」ピクセルで表すことになります。これは,本質的に主成分分析とは呼ばないでしょう。
主成分分析は,複数のデータ点の特徴を保持するような射影先の軸を見つける手法です。ですので,画像に主成分分析を行う場合は似たような画像をいくつか用意する必要があります。今回は,グー・チョキ・パーの画像をそれぞれ14枚ずつ「64×64」ピクセルで用意しました。
必要なライブラリのインポート
import matplotlib.pyplot as plt
import numpy as np
import numpy.linalg as LA
from PIL import Image
Googleドライブをマウントして画像を取り込めるようにする
from google.colab import drive
drive.mount('/content/drive')
データを配列化する
data = np.zeros(height*width*N).reshape(N, height*width)
for i in range(N):
  data[i] = np.array(Image.open("./drive/My Drive/Colab/imagedata"+str(i)+".bmp")).flatten()
オリジナル画像の可視化
height = 64
width = 64
N = 42

data_drawing = data.reshape(N, height, width)

fig1 = plt.figure(figsize=(6,6))
fig1.subplots_adjust(left=0, right=1, bottom=0, top=1, hspace=0.05, wspace=0.05)

for i in range(N):
  ax1 = fig1.add_subplot(7, 6, i+1, xticks=[], yticks=[])
  ax1.imshow(data_drawing[i], cmap=plt.cm.gray, interpolation='nearest')

plt.show()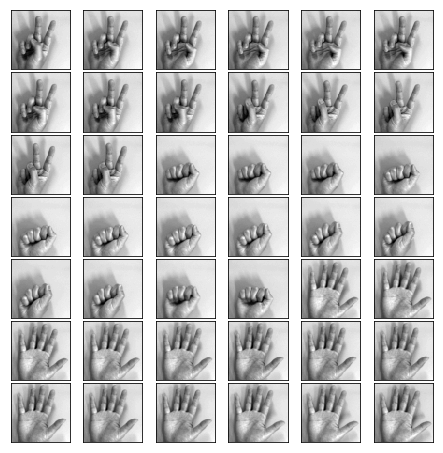
固有値・固有ベクトルを求めて大きい順にソートする関数
def eigsort(S):
  eigv_raw, u_raw = LA.eig(S)
  eigv_index = np.argsort(eigv_raw)[::-1]
  eigv = eigv_raw[eigv_index]
  u = u_raw[:, eigv_index]
  return [eigv, u]
データの統計量を求める
m = np.mean(data, axis=0)
data_m = data - m[None, :]
S_inner = np.array((1/N) * ((data_m) @ (data_m).T))
今回は,$\frac{1}{N}X^TX$の固有ベクトルから共分散行列$\frac{1}{N}XX^T$の固有ベクトルを求めます。また,$\frac{1}{N}XX^T$と$\frac{1}{N}X^TX$の固有値は同じであることに注意が必要です。
\begin{eqnarray}
\frac{1}{N}XX^T u_i = \lambda_i u_i\\
\frac{1}{N}X^TX(X^T u_i) = \lambda_i (X^Tu_i)\\
\frac{1}{N}X^TX v_i = \lambda_i v_i\\
u_i = \frac{1}{\sqrt{N \lambda_i}} Xv_i
\end{eqnarray}
上の式に従い共分散行列の固有値・固有ベクトルを求める
[eig, u_inner] = eigsort(S_inner)

u = np.array((data_m.T @ u_inner)/np.sqrt(N * eig))
CCR(累積寄与率)を求める
xlist = np.arange(eig.shape[0])
y = np.cumsum(eig)
ylist = y / y[-1]
plt.plot(xlist, ylist)

index = np.where(ylist>=0.8)[0]
print("The number of axes which first achieve 80%:"+str(index[0] +1))
The number of axes which first achieve 80%:4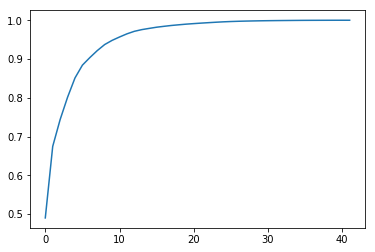
CCR(累積寄与率)を4本目まで表示
ylist[:index[0]+1]array([0.49013065, 0.6746733 , 0.7438474 , 0.80136593])
基底の本数を選ぶ
principals = 3
u_compressed = u[:, 0:principals]
今回は,基底を3本にしてみました。
基底を可視化
fig2 = plt.figure(figsize=(20,20))
fig2.subplots_adjust(left=0, right=1, bottom=0, top=1, hspace=0.05, wspace=0.05)

from matplotlib.colors import Normalize
from matplotlib.cm import ScalarMappable, get_cmap
norm = Normalize(vmin=u_drawing.min(), vmax=u_drawing.max())
cmap = get_cmap('PuOr')
mappable = ScalarMappable(cmap=cmap, norm=norm)
mappable._A = []

for i in range(principals):
  ax2 = fig2.add_subplot(7,6, i+1, xticks=[], yticks=[])
  ax2.imshow(u_drawing[i], cmap=cmap, interpolation='nearest')

cbar = plt.colorbar(mappable)
ticks = np.linspace(norm.vmin, norm.vmax, 5)
cbar.set_ticks(ticks)
3本の基底でデータ再構築
data_reconstruct_drawing = data_reconstruct.reshape(N, height, width)
チョキの画像を適当に表示
N_drawing = 0

fig3 = plt.figure(figsize=(10,10))
fig3.subplots_adjust(left=0, right=1, bottom=0, top=1, hspace=0.05, wspace=0.05)

ax3 = fig3.add_subplot(1,2, 1, xticks=[], yticks=[])
ax3.imshow(data_reconstruct_drawing[N_drawing], cmap=plt.cm.gray, interpolation='nearest')
ax4 = fig3.add_subplot(1,2, 2, xticks=[], yticks=[])
ax4.imshow(data_drawing[N_drawing,:], cmap=plt.cm.gray, interpolation='nearest')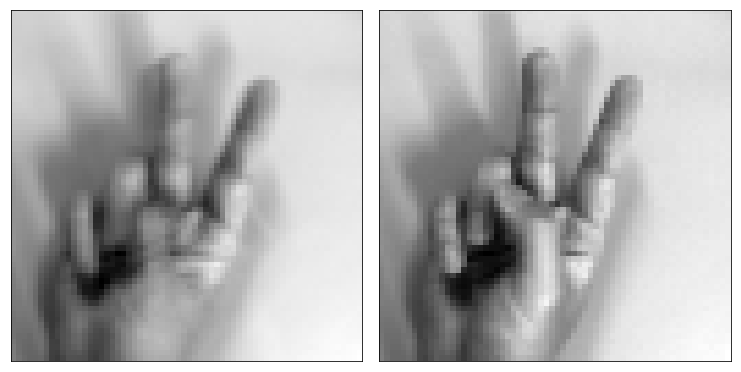
グーの画像を適当に表示
N_drawing = 15

fig3 = plt.figure(figsize=(10,10))
fig3.subplots_adjust(left=0, right=1, bottom=0, top=1, hspace=0.05, wspace=0.05)

ax3 = fig3.add_subplot(1,2, 1, xticks=[], yticks=[])
ax3.imshow(data_reconstruct_drawing[N_drawing], cmap=plt.cm.gray, interpolation='nearest')
ax4 = fig3.add_subplot(1,2, 2, xticks=[], yticks=[])
ax4.imshow(data_drawing[N_drawing,:], cmap=plt.cm.gray, interpolation='nearest')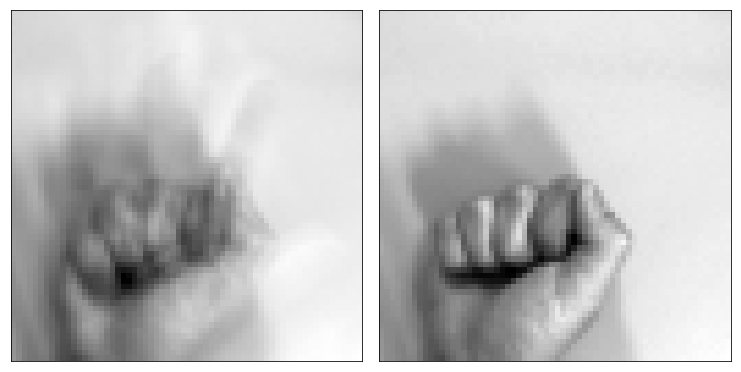
パーの画像を適当に表示
N_drawing = 29

fig3 = plt.figure(figsize=(10,10))
fig3.subplots_adjust(left=0, right=1, bottom=0, top=1, hspace=0.05, wspace=0.05)

ax3 = fig3.add_subplot(1,2, 1, xticks=[], yticks=[])
ax3.imshow(data_reconstruct_drawing[N_drawing], cmap=plt.cm.gray, interpolation='nearest')
ax4 = fig3.add_subplot(1,2, 2, xticks=[], yticks=[])
ax4.imshow(data_drawing[N_drawing,:], cmap=plt.cm.gray, interpolation='nearest')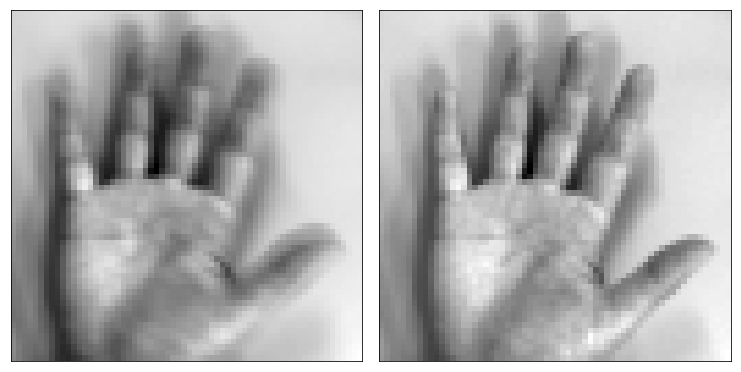
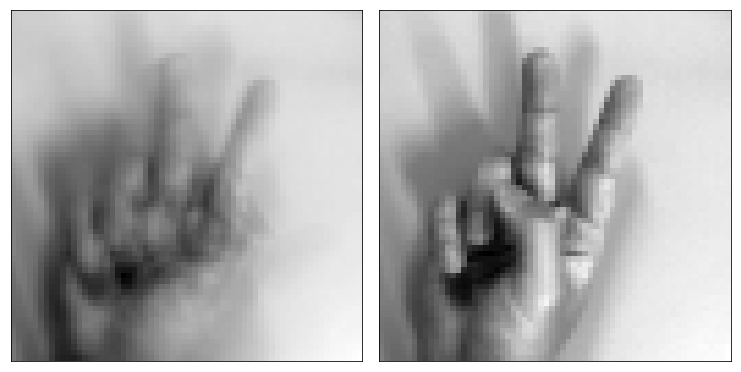
基底を1本だけにした場合の再構成
principals = 1
u_compressed = u[:, 0:principals]

data_reconstruct = data_m @ u_compressed @ u_compressed.T + m
u_drawing = u_compressed.T.reshape(principals, height, width)

data_reconstruct_drawing = data_reconstruct.reshape(N, height, width)

N_drawing = 0

fig4 = plt.figure(figsize=(10,10))
fig4.subplots_adjust(left=0, right=1, bottom=0, top=1, hspace=0.05, wspace=0.05)

ax5 = fig4.add_subplot(1,2, 1, xticks=[], yticks=[])
ax5.imshow(data_reconstruct_drawing[N_drawing], cmap=plt.cm.gray, interpolation='nearest')
ax6 = fig4.add_subplot(1,2, 2, xticks=[], yticks=[])
ax6.imshow(data_drawing[N_drawing,:], cmap=plt.cm.gray, interpolation='nearest')
基底を42本全て選んだときの再構成
principals = 42
u_compressed = u[:, 0:principals]

data_reconstruct = data_m @ u_compressed @ u_compressed.T + m
u_drawing = u_compressed.T.reshape(principals, height, width)

data_reconstruct_drawing = data_reconstruct.reshape(N, height, width)

N_drawing = 0

fig4 = plt.figure(figsize=(10,10))
fig4.subplots_adjust(left=0, right=1, bottom=0, top=1, hspace=0.05, wspace=0.05)

ax5 = fig4.add_subplot(1,2, 1, xticks=[], yticks=[])
ax5.imshow(data_reconstruct_drawing[N_drawing], cmap=plt.cm.gray, interpolation='nearest')
ax6 = fig4.add_subplot(1,2, 2, xticks=[], yticks=[])
ax6.imshow(data_drawing[N_drawing,:], cmap=plt.cm.gray, interpolation='nearest')
基底を2つでクラスタリング
principals = 2
u_compressed = u[:, 0:principals]

pca_score = data_m @ u_compressed
data_reconstruct = data_m @ u_compressed @ u_compressed.T + m
u_drawing = u_compressed.T.reshape(principals, height, width)

data_reconstruct_drawing = data_reconstruct.reshape(N, height, width)

xlist_choki = pca_score[0:14, 0]
xlist_gu = pca_score[14:28, 0]
xlist_pa = pca_score[28:42, 0]

ylist_choki = pca_score[0:14, 1]
ylist_gu = pca_score[14:28, 1]
ylist_pa = pca_score[28:42, 1]

cm = plt.get_cmap("tab10")

plt.plot(xlist_choki, ylist_choki, 'o', color=cm(0))
plt.plot(xlist_gu, ylist_gu, 'o', color=cm(1))
plt.plot(xlist_pa, ylist_pa, 'o', color=cm(2))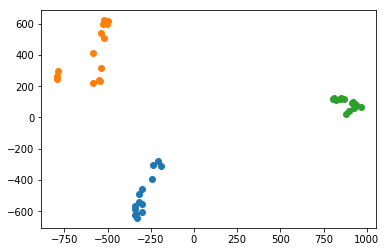
基底を1つでクラスタリング
principals = 1
u_compressed = u[:, 0:principals]

pca_score = data_m @ u_compressed
data_reconstruct = data_m @ u_compressed @ u_compressed.T + m
u_drawing = u_compressed.T.reshape(principals, height, width)

data_reconstruct_drawing = data_reconstruct.reshape(N, height, width)

xlist_choki = pca_score[0:14, 0]
xlist_gu = pca_score[14:28, 0]
xlist_pa = pca_score[28:42, 0]

cm = plt.get_cmap("tab10")

plt.hist(xlist_choki, alpha=0.7, color=cm(0))
plt.hist(xlist_gu, alpha=0.7, color=cm(1))
plt.hist(xlist_pa, alpha=0.7, color=cm(2))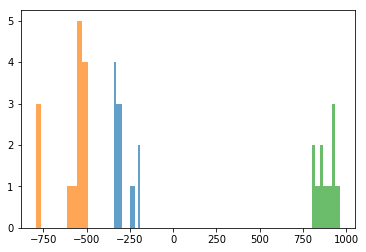
考察
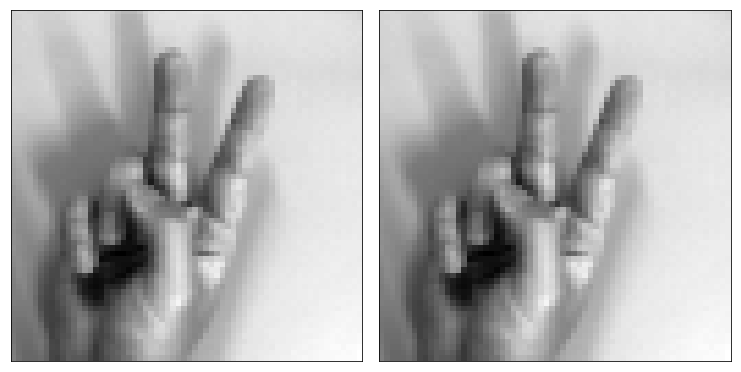
まず,基底を4本以上選んだ場合にCCRが80%を越えました。1本だけでは49%,2本だけでは67%という結果でした。実際に,1本だけの基底によって再構築された画像を見てみると,ノイズがのってしまっていることが分かります。基底3本で再構築された画像も,まだ劣化していると主観的にも感じました。基底を42本選んだ場合は,オリジナル画像にかなり近い出力となりました。
基底を1本えらぶだけで,グー・チョキ・パーの3クラスを分類することができました。基底を2本選んでも,二次元平面上で明確にクラスタリングされていました。
もし理論にモヤモヤがあれば
(2026/01/31 02:57:33時点 楽天市場調べ-詳細)
こちらの参考書は,PRMLよりも平易に機械学習全般の手法について解説しています。おすすめの1冊になりますので,ぜひお手に取って確認してみてください。
全コード
import matplotlib.pyplot as plt
import numpy as np
import numpy.linalg as LA
from PIL import Image

height = 64
width = 64
N = 42

from google.colab import drive
drive.mount('/content/drive')


data = np.zeros(height*width*N).reshape(N, height*width)
for i in range(N):
  data[i] = np.array(Image.open("./drive/My Drive/Colab/report/Pattern recognition advanced/handdata/"+str(i)+".bmp")).flatten()

data_drawing = data.reshape(N, height, width)

fig1 = plt.figure(figsize=(6,6))
fig1.subplots_adjust(left=0, right=1, bottom=0, top=1, hspace=0.05, wspace=0.05)

for i in range(N):
  ax1 = fig1.add_subplot(7, 6, i+1, xticks=[], yticks=[])
  ax1.imshow(data_drawing[i], cmap=plt.cm.gray, interpolation='nearest')

plt.show()

def eigsort(S):
  eigv_raw, u_raw = LA.eig(S)
  eigv_index = np.argsort(eigv_raw)[::-1]
  eigv = eigv_raw[eigv_index]
  u = u_raw[:, eigv_index]
  return [eigv, u]

m = np.mean(data, axis=0)
data_m = data - m[None, :]
S_inner = np.array((1/N) * ((data_m) @ (data_m).T))

[eig, u_inner] = eigsort(S_inner)

u = np.array((data_m.T @ u_inner)/np.sqrt(N * eig))

xlist = np.arange(eig.shape[0])
y = np.cumsum(eig)
ylist = y / y[-1]
plt.plot(xlist, ylist)

index = np.where(ylist>=0.8)[0]
print("The number of axes which first achieve 80%:"+str(index[0] +1))

ylist[:index[0]+1]

principals = 3
u_compressed = u[:, 0:principals]

data_reconstruct = data_m @ u_compressed @ u_compressed.T + m
u_drawing = u_compressed.T.reshape(principals, height, width)

fig2 = plt.figure(figsize=(20,20))
fig2.subplots_adjust(left=0, right=1, bottom=0, top=1, hspace=0.05, wspace=0.05)

from matplotlib.colors import Normalize
from matplotlib.cm import ScalarMappable, get_cmap
norm = Normalize(vmin=u_drawing.min(), vmax=u_drawing.max())
cmap = get_cmap('PuOr')
mappable = ScalarMappable(cmap=cmap, norm=norm)
mappable._A = []

for i in range(principals):
  ax2 = fig2.add_subplot(7,6, i+1, xticks=[], yticks=[])
  ax2.imshow(u_drawing[i], cmap=cmap, interpolation='nearest')

cbar = plt.colorbar(mappable)
ticks = np.linspace(norm.vmin, norm.vmax, 5)
cbar.set_ticks(ticks)

data_reconstruct_drawing = data_reconstruct.reshape(N, height, width)

N_drawing = 0

fig3 = plt.figure(figsize=(10,10))
fig3.subplots_adjust(left=0, right=1, bottom=0, top=1, hspace=0.05, wspace=0.05)

ax3 = fig3.add_subplot(1,2, 1, xticks=[], yticks=[])
ax3.imshow(data_reconstruct_drawing[N_drawing], cmap=plt.cm.gray, interpolation='nearest')
ax4 = fig3.add_subplot(1,2, 2, xticks=[], yticks=[])
ax4.imshow(data_drawing[N_drawing,:], cmap=plt.cm.gray, interpolation='nearest')

N_drawing = 15

fig3 = plt.figure(figsize=(10,10))
fig3.subplots_adjust(left=0, right=1, bottom=0, top=1, hspace=0.05, wspace=0.05)

ax3 = fig3.add_subplot(1,2, 1, xticks=[], yticks=[])
ax3.imshow(data_reconstruct_drawing[N_drawing], cmap=plt.cm.gray, interpolation='nearest')
ax4 = fig3.add_subplot(1,2, 2, xticks=[], yticks=[])
ax4.imshow(data_drawing[N_drawing,:], cmap=plt.cm.gray, interpolation='nearest')

N_drawing = 29

fig3 = plt.figure(figsize=(10,10))
fig3.subplots_adjust(left=0, right=1, bottom=0, top=1, hspace=0.05, wspace=0.05)

ax3 = fig3.add_subplot(1,2, 1, xticks=[], yticks=[])
ax3.imshow(data_reconstruct_drawing[N_drawing], cmap=plt.cm.gray, interpolation='nearest')
ax4 = fig3.add_subplot(1,2, 2, xticks=[], yticks=[])
ax4.imshow(data_drawing[N_drawing,:], cmap=plt.cm.gray, interpolation='nearest')

principals = 1
u_compressed = u[:, 0:principals]

data_reconstruct = data_m @ u_compressed @ u_compressed.T + m
u_drawing = u_compressed.T.reshape(principals, height, width)

data_reconstruct_drawing = data_reconstruct.reshape(N, height, width)

N_drawing = 0

fig4 = plt.figure(figsize=(10,10))
fig4.subplots_adjust(left=0, right=1, bottom=0, top=1, hspace=0.05, wspace=0.05)

ax5 = fig4.add_subplot(1,2, 1, xticks=[], yticks=[])
ax5.imshow(data_reconstruct_drawing[N_drawing], cmap=plt.cm.gray, interpolation='nearest')
ax6 = fig4.add_subplot(1,2, 2, xticks=[], yticks=[])
ax6.imshow(data_drawing[N_drawing,:], cmap=plt.cm.gray, interpolation='nearest')


principals = 42
u_compressed = u[:, 0:principals]

data_reconstruct = data_m @ u_compressed @ u_compressed.T + m
u_drawing = u_compressed.T.reshape(principals, height, width)

data_reconstruct_drawing = data_reconstruct.reshape(N, height, width)

N_drawing = 0

fig4 = plt.figure(figsize=(10,10))
fig4.subplots_adjust(left=0, right=1, bottom=0, top=1, hspace=0.05, wspace=0.05)

ax5 = fig4.add_subplot(1,2, 1, xticks=[], yticks=[])
ax5.imshow(data_reconstruct_drawing[N_drawing], cmap=plt.cm.gray, interpolation='nearest')
ax6 = fig4.add_subplot(1,2, 2, xticks=[], yticks=[])
ax6.imshow(data_drawing[N_drawing,:], cmap=plt.cm.gray, interpolation='nearest')


principals = 2
u_compressed = u[:, 0:principals]

pca_score = data_m @ u_compressed
data_reconstruct = data_m @ u_compressed @ u_compressed.T + m
u_drawing = u_compressed.T.reshape(principals, height, width)

data_reconstruct_drawing = data_reconstruct.reshape(N, height, width)

xlist_choki = pca_score[0:14, 0]
xlist_gu = pca_score[14:28, 0]
xlist_pa = pca_score[28:42, 0]

ylist_choki = pca_score[0:14, 1]
ylist_gu = pca_score[14:28, 1]
ylist_pa = pca_score[28:42, 1]

cm = plt.get_cmap("tab10")

plt.plot(xlist_choki, ylist_choki, 'o', color=cm(0))
plt.plot(xlist_gu, ylist_gu, 'o', color=cm(1))
plt.plot(xlist_pa, ylist_pa, 'o', color=cm(2))

principals = 1
u_compressed = u[:, 0:principals]

pca_score = data_m @ u_compressed
data_reconstruct = data_m @ u_compressed @ u_compressed.T + m
u_drawing = u_compressed.T.reshape(principals, height, width)

data_reconstruct_drawing = data_reconstruct.reshape(N, height, width)

xlist_choki = pca_score[0:14, 0]
xlist_gu = pca_score[14:28, 0]
xlist_pa = pca_score[28:42, 0]

cm = plt.get_cmap("tab10")

plt.hist(xlist_choki, alpha=0.7, color=cm(0))
plt.hist(xlist_gu, alpha=0.7, color=cm(1))
plt.hist(xlist_pa, alpha=0.7, color=cm(2))







こんにちは。主成分分析を勉強している学生です。
本当に分かりやすい説明助かりました。
これを参考にして実装してみましたが、私は100*100の画像を用いてデータを配列化するときにエラーがでました。
shapeが10000ではなく30000であるからarrayできないということですが、もし、これについて解決法などございませんか。
ざっくりした説明で申し訳ないですが、よろしくお願いいたします。
ご質問ありがとうございます!
そして,お返事が遅くなり大変申し訳ありません。
もう手遅れとは思いますが,問題の箇所をこのコメント欄かメールで送って下されば見させてもらうことは可能です。
ご返信ありがとうございます!!
前に聞かせて頂いた質問は解決できました!お陰様です!
しかし、他に質問がございますが、<基底を2つでクラスタリング>の中にpca_scoreというコマンドがあると思いますが、これはどんな意味をしているのか教えていただけるでしょうか。
ご返信お待ちしております。よろしくお願いいたします。
主成分得点(スコア)を意味しているのでしょうか?
主成分スコアですね!